
📊Customer voice dashboards
Understand and make customer feedback actionable.
Introduction

It will help you answer your biggest product questions such as:
What are the major pain points for users, and which features are they most eager for?
Which customers give the most feedback?
Do small and big customers have similar needs?
Which Sales/Success people provide the most product feedback?
Choose to display the information at the company or user level.
Then slice and dice product feedback with filters on MRR, customer lifecycle, and time frames (like the last 7 or 30 days). It helps you understand whether you have market opportunities, but also keep track of company requests & identify the team members that contribute the most to feedback.


We all have crucial questions, and this feature aims to answer them.
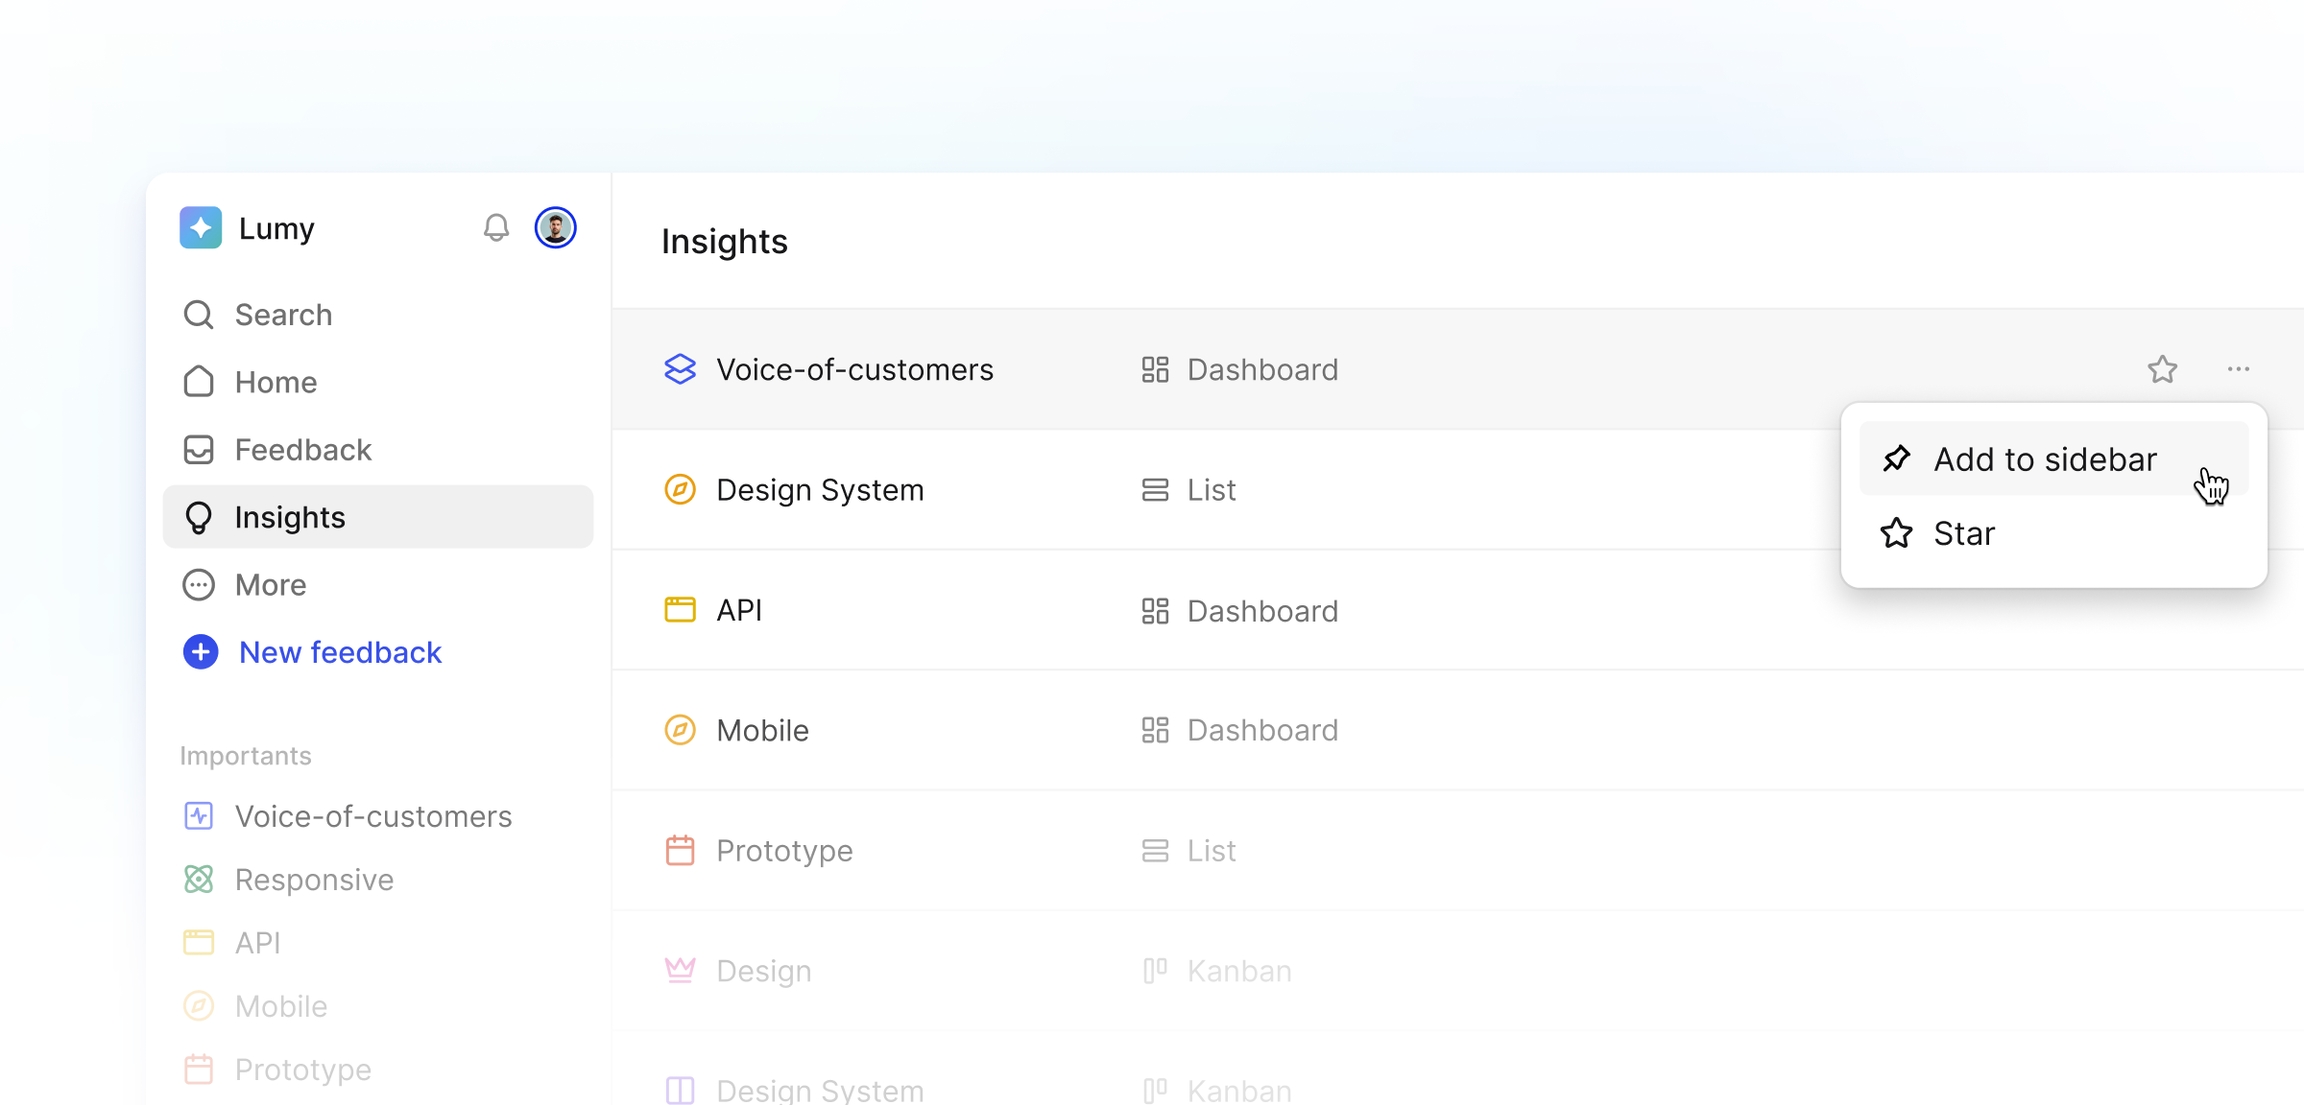
Multi-dashboard
Having a single product dashboard to track trends was great—but now, you can create multiple dashboards tailored to specific use cases. They become integral parts of your daily workflows, just like your other views.
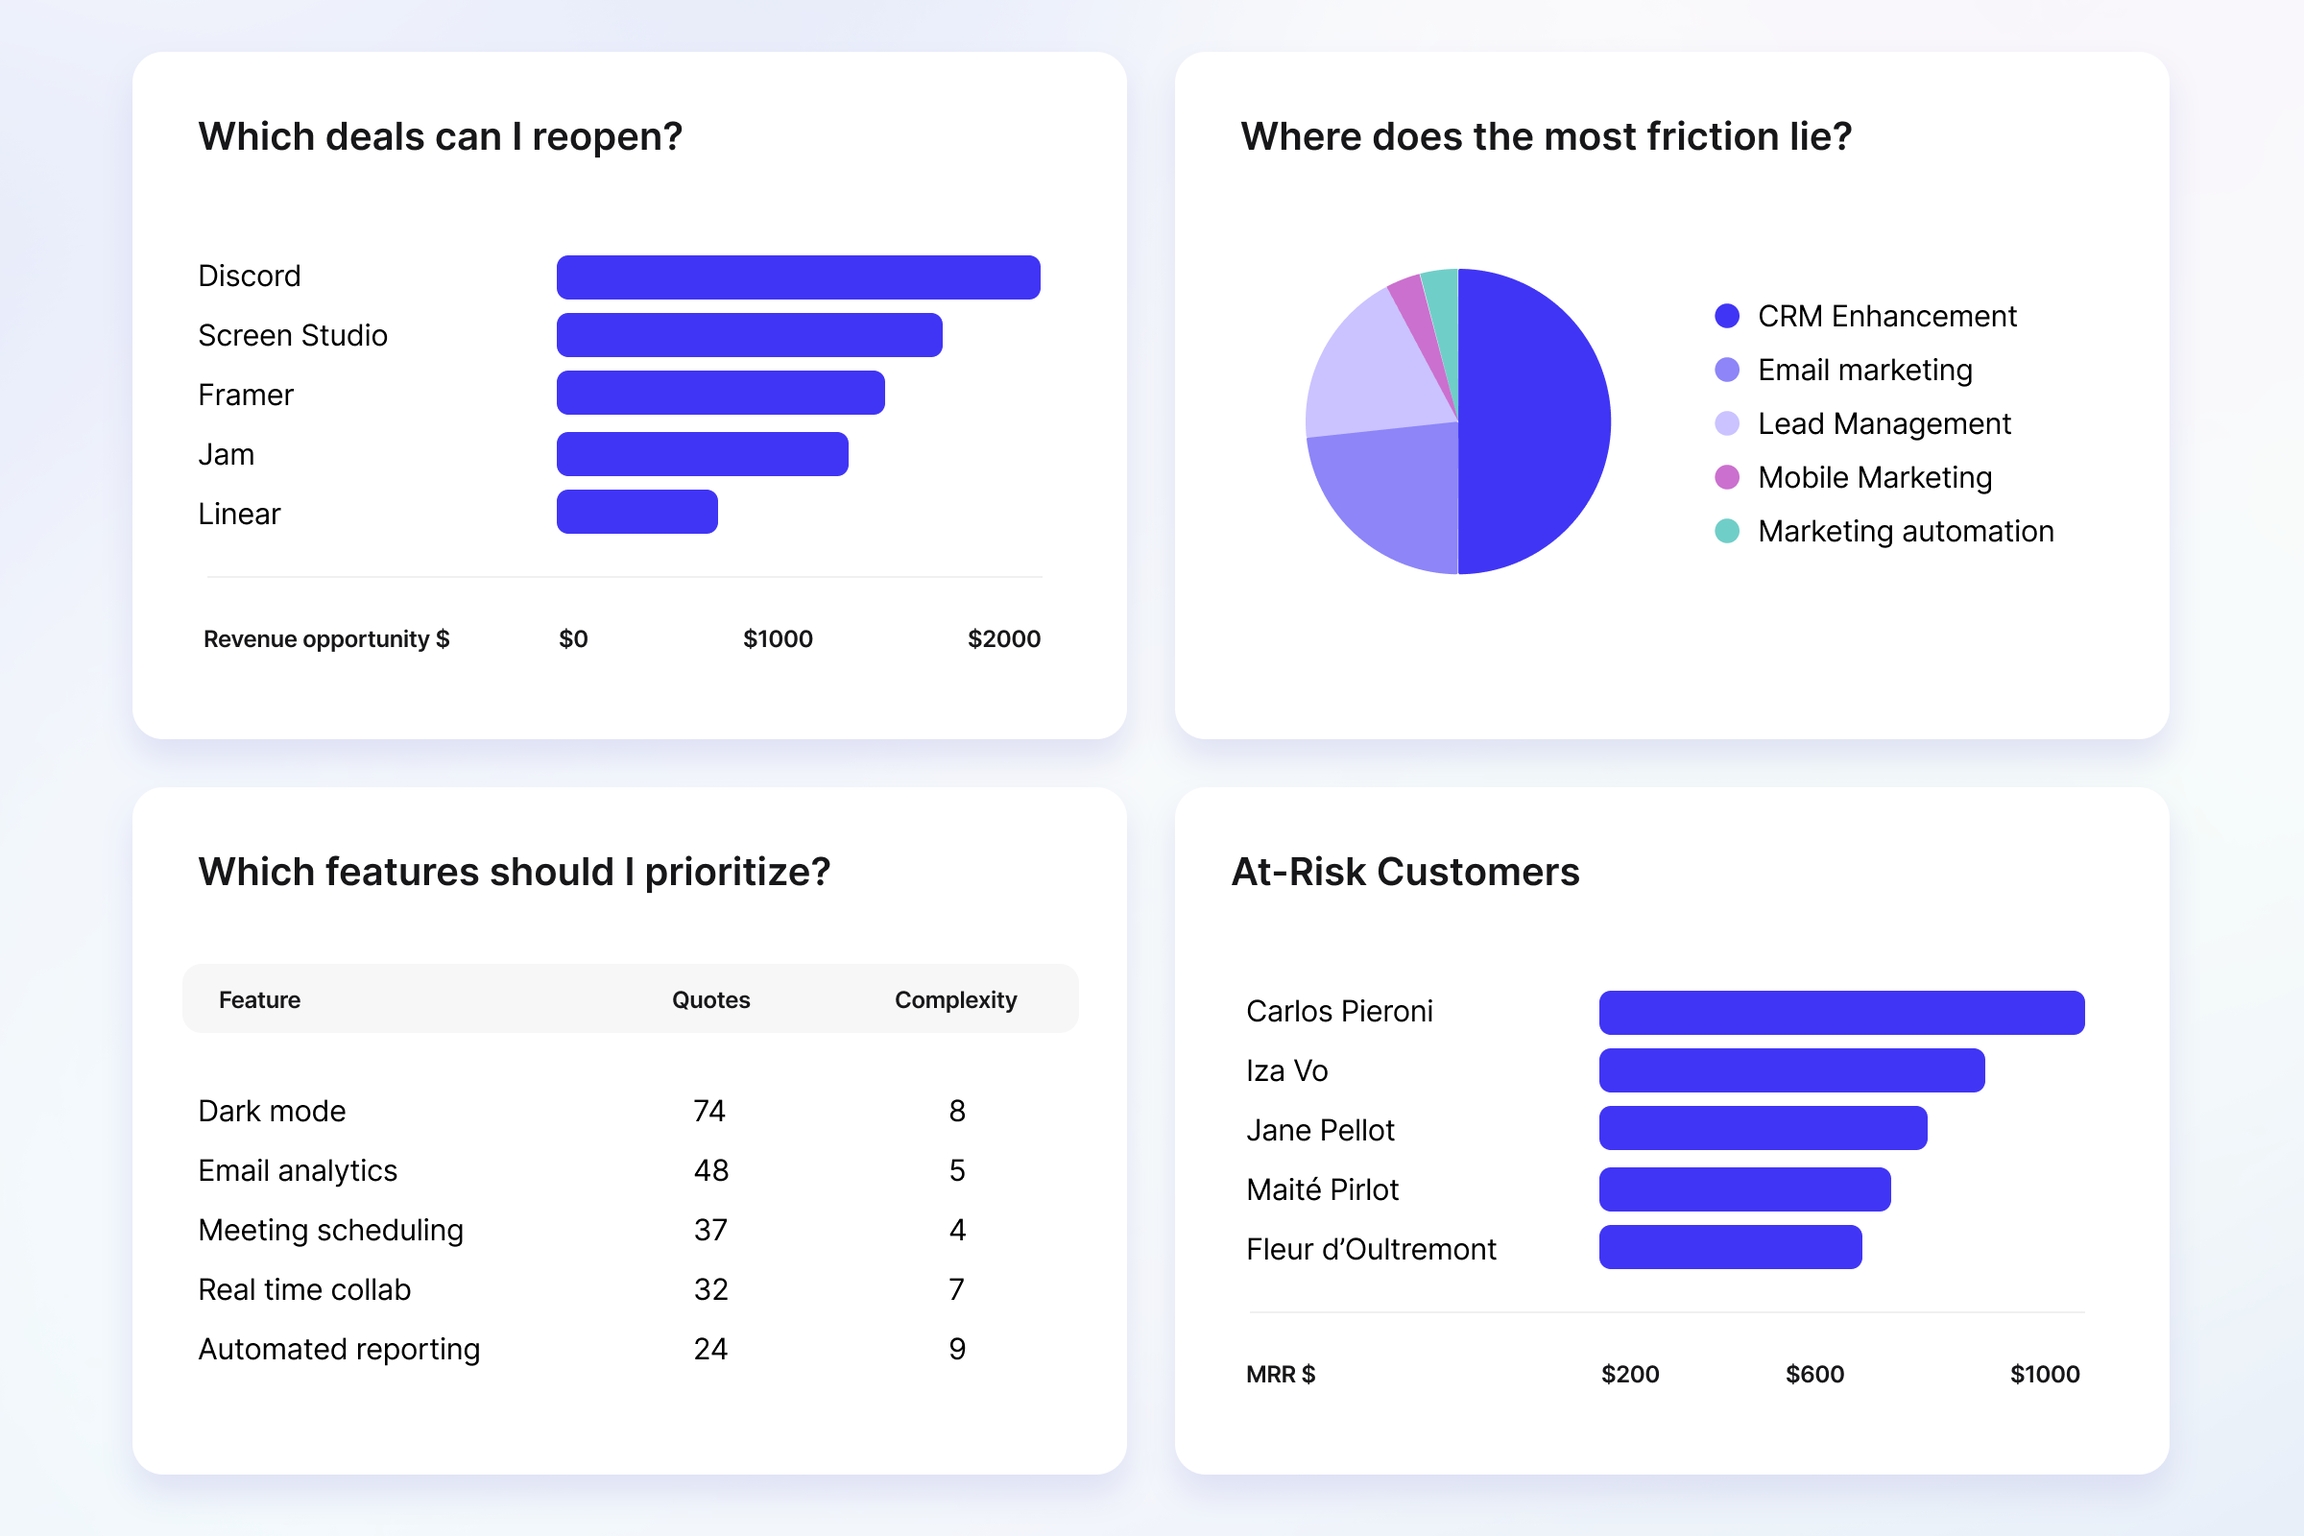

Here are just a few examples of the powerful dashboards you can now enable:
Revenue & Expansion Opportunities: Identify upsell and cross-sell opportunities
Friction analysis: Highlight misunderstood product areas that are causing friction for users
Feature prioritization: Prioritize based on feedback volume, technical complexity, impact, or custom formulas
At-risk customer analysis: Deep dive into feedback from customers at risk of churning to guide targeted retention efforts
User research: Organize interview findings by themes, personas, or user journeys to uncover patterns, pain points, and unmet needs
Feature adoption: Track which features are gaining traction and identify which customer segments are using them
Trends by segment: Understand differences in pain points and feature requests across customer segments
PMF survey: Inspired by Superhuman, track Product-Market Fit progress by measuring how disappointed users would be if your product disappeared
Feedback loop velocity: Track the time it takes your team to close the loop after solving customer issues. Identify bottlenecks in your processes and improve them
Contributor feedback analysis: Track feedback volume, top contributors, and monthly trends. Filter data to spotlight valuable contributors and recognize their impact
You can also now pin, star, rename and even add descriptions to your dashboards.
Want to try one of these templates? Have another dashboard in mind? Reach out, and we’ll make it happen for you!
Cross-feedback AI-generated summaries
Save hours of navigating through feedback, and instead get instant insights. This feature is perfect for understanding core customer needs when you have hundreds of feedback entries.

Search a specific area in your dashboard, click "Summarize," and get a quick, clear summary of the main points. Use it for:
High-Level Prioritization: Select a segment and see the biggest needs at a glance.
Granular Insights: Dive into specific topics to identify the most important parts
Cherry on the cake, it’s super easy to copy-paste the result and share it with your colleagues.

🔄 Manually refresh your dashboard
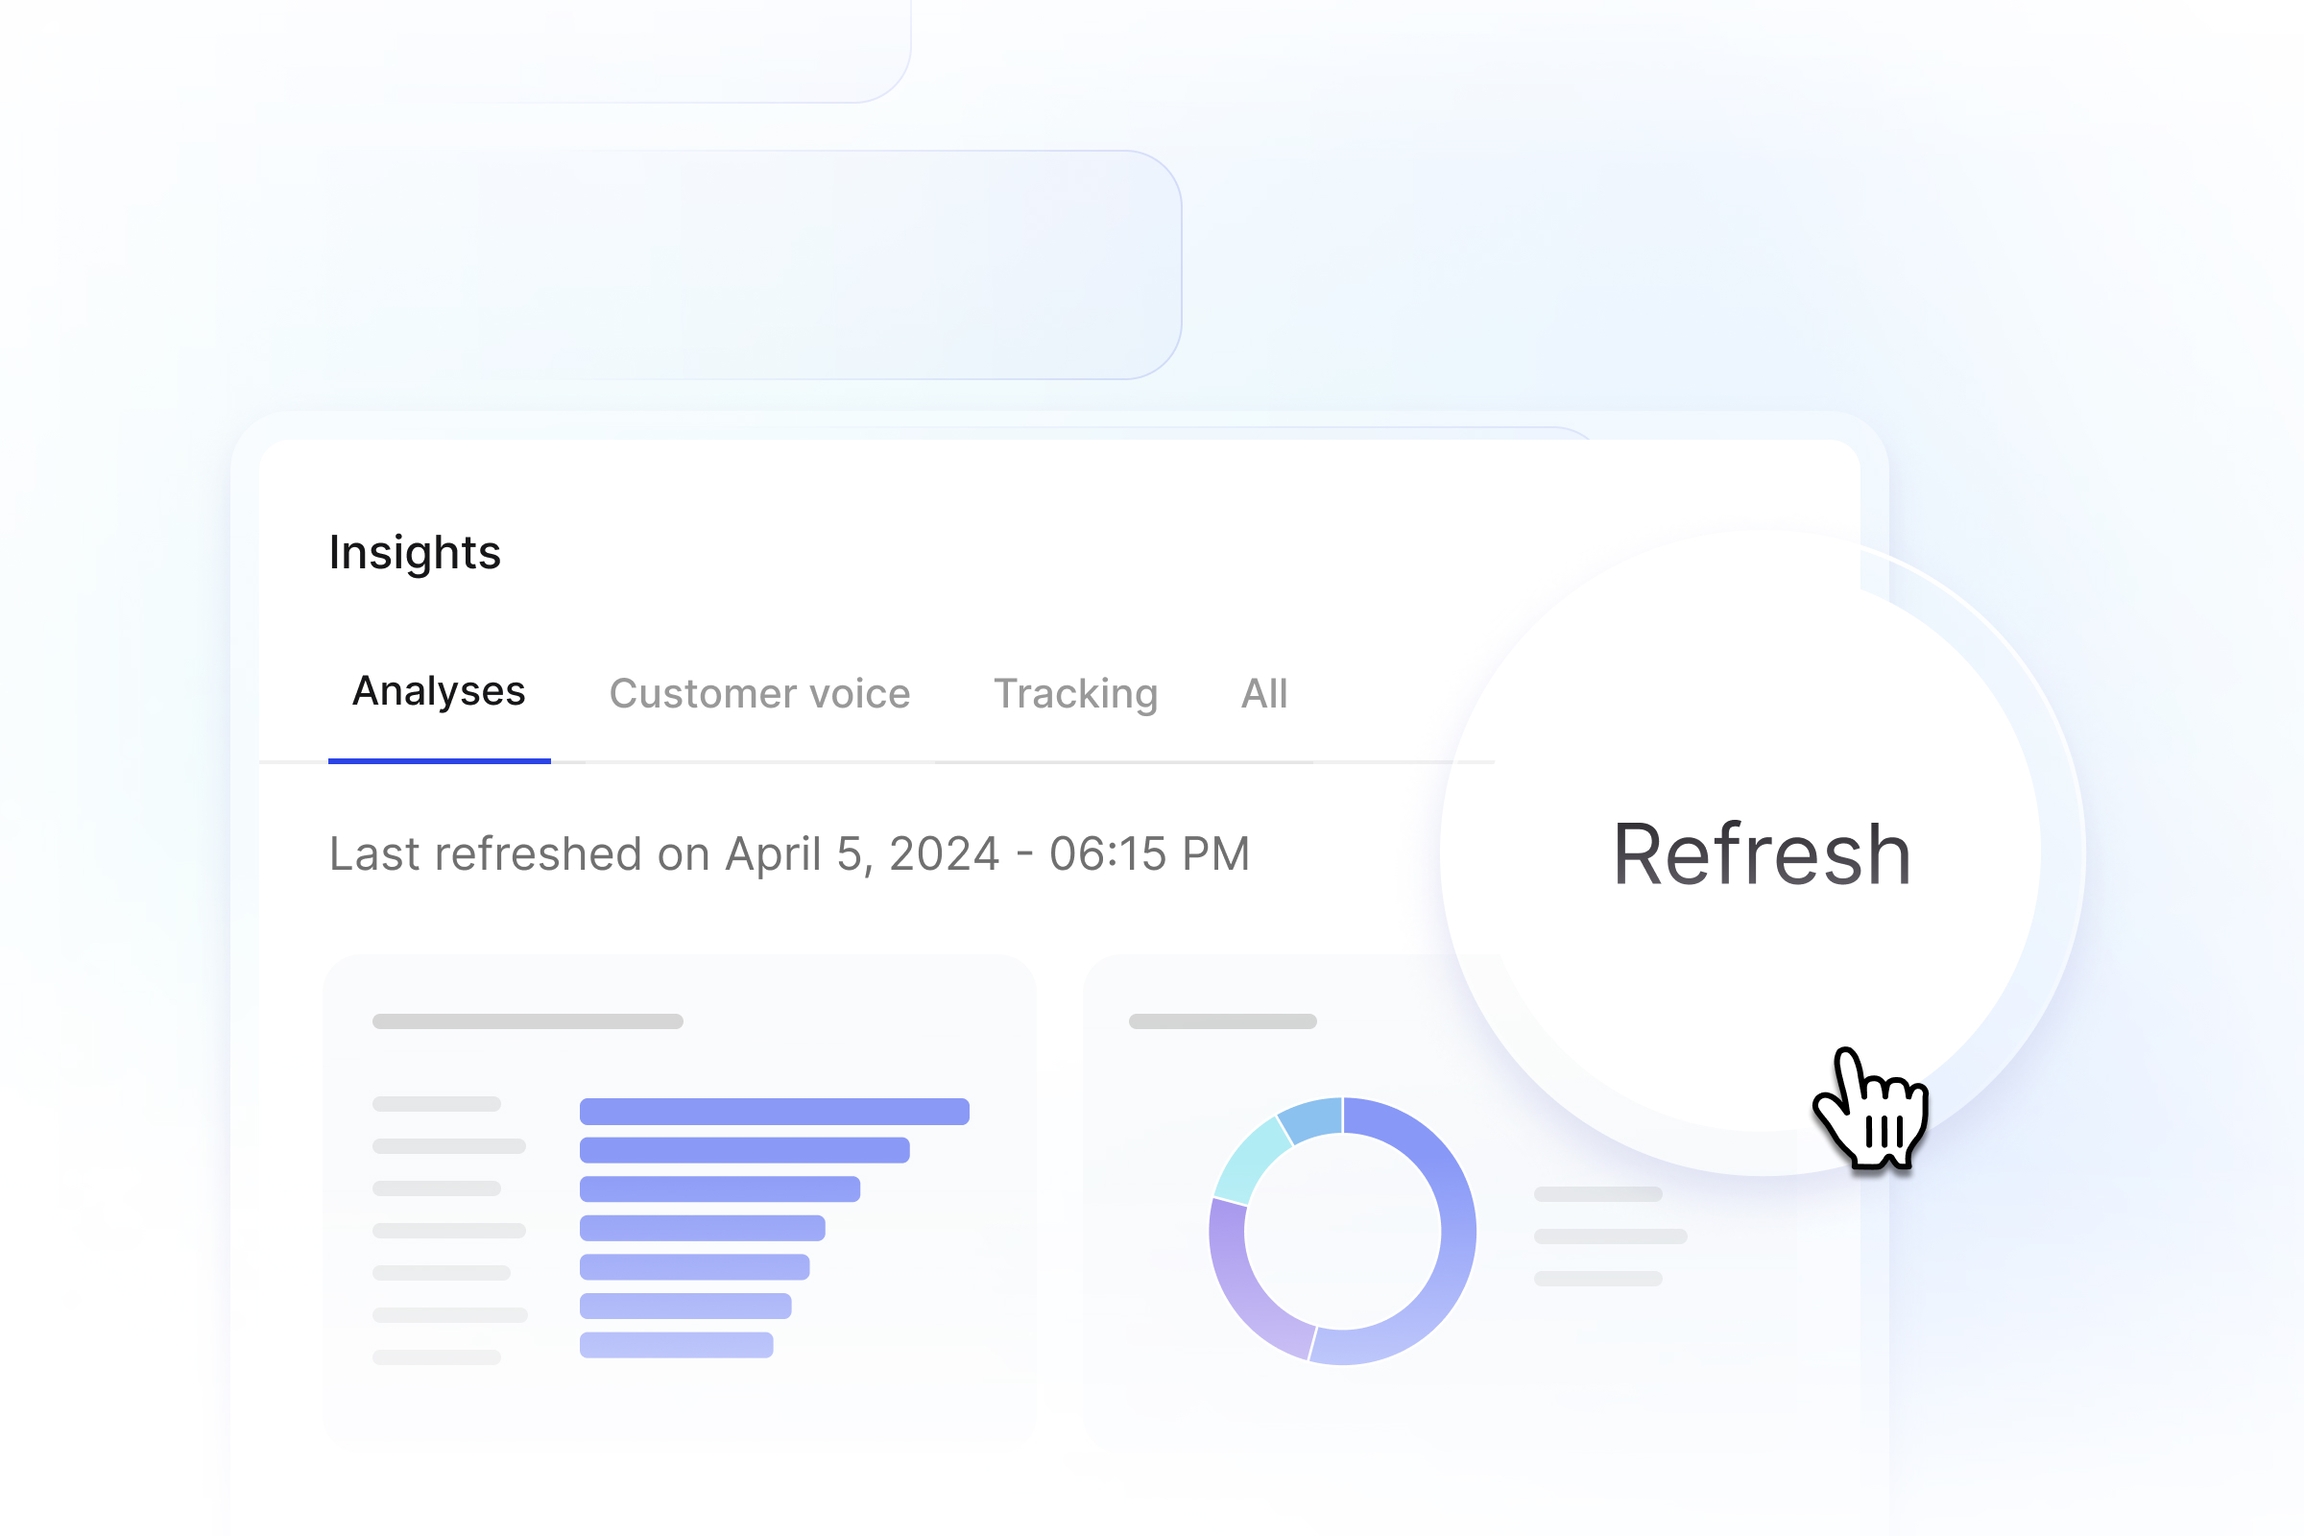
Just processed some feedback and want to update your dashboard accordingly? Just click on the refresh button. No more waiting till the next day to access fresh data ⏳
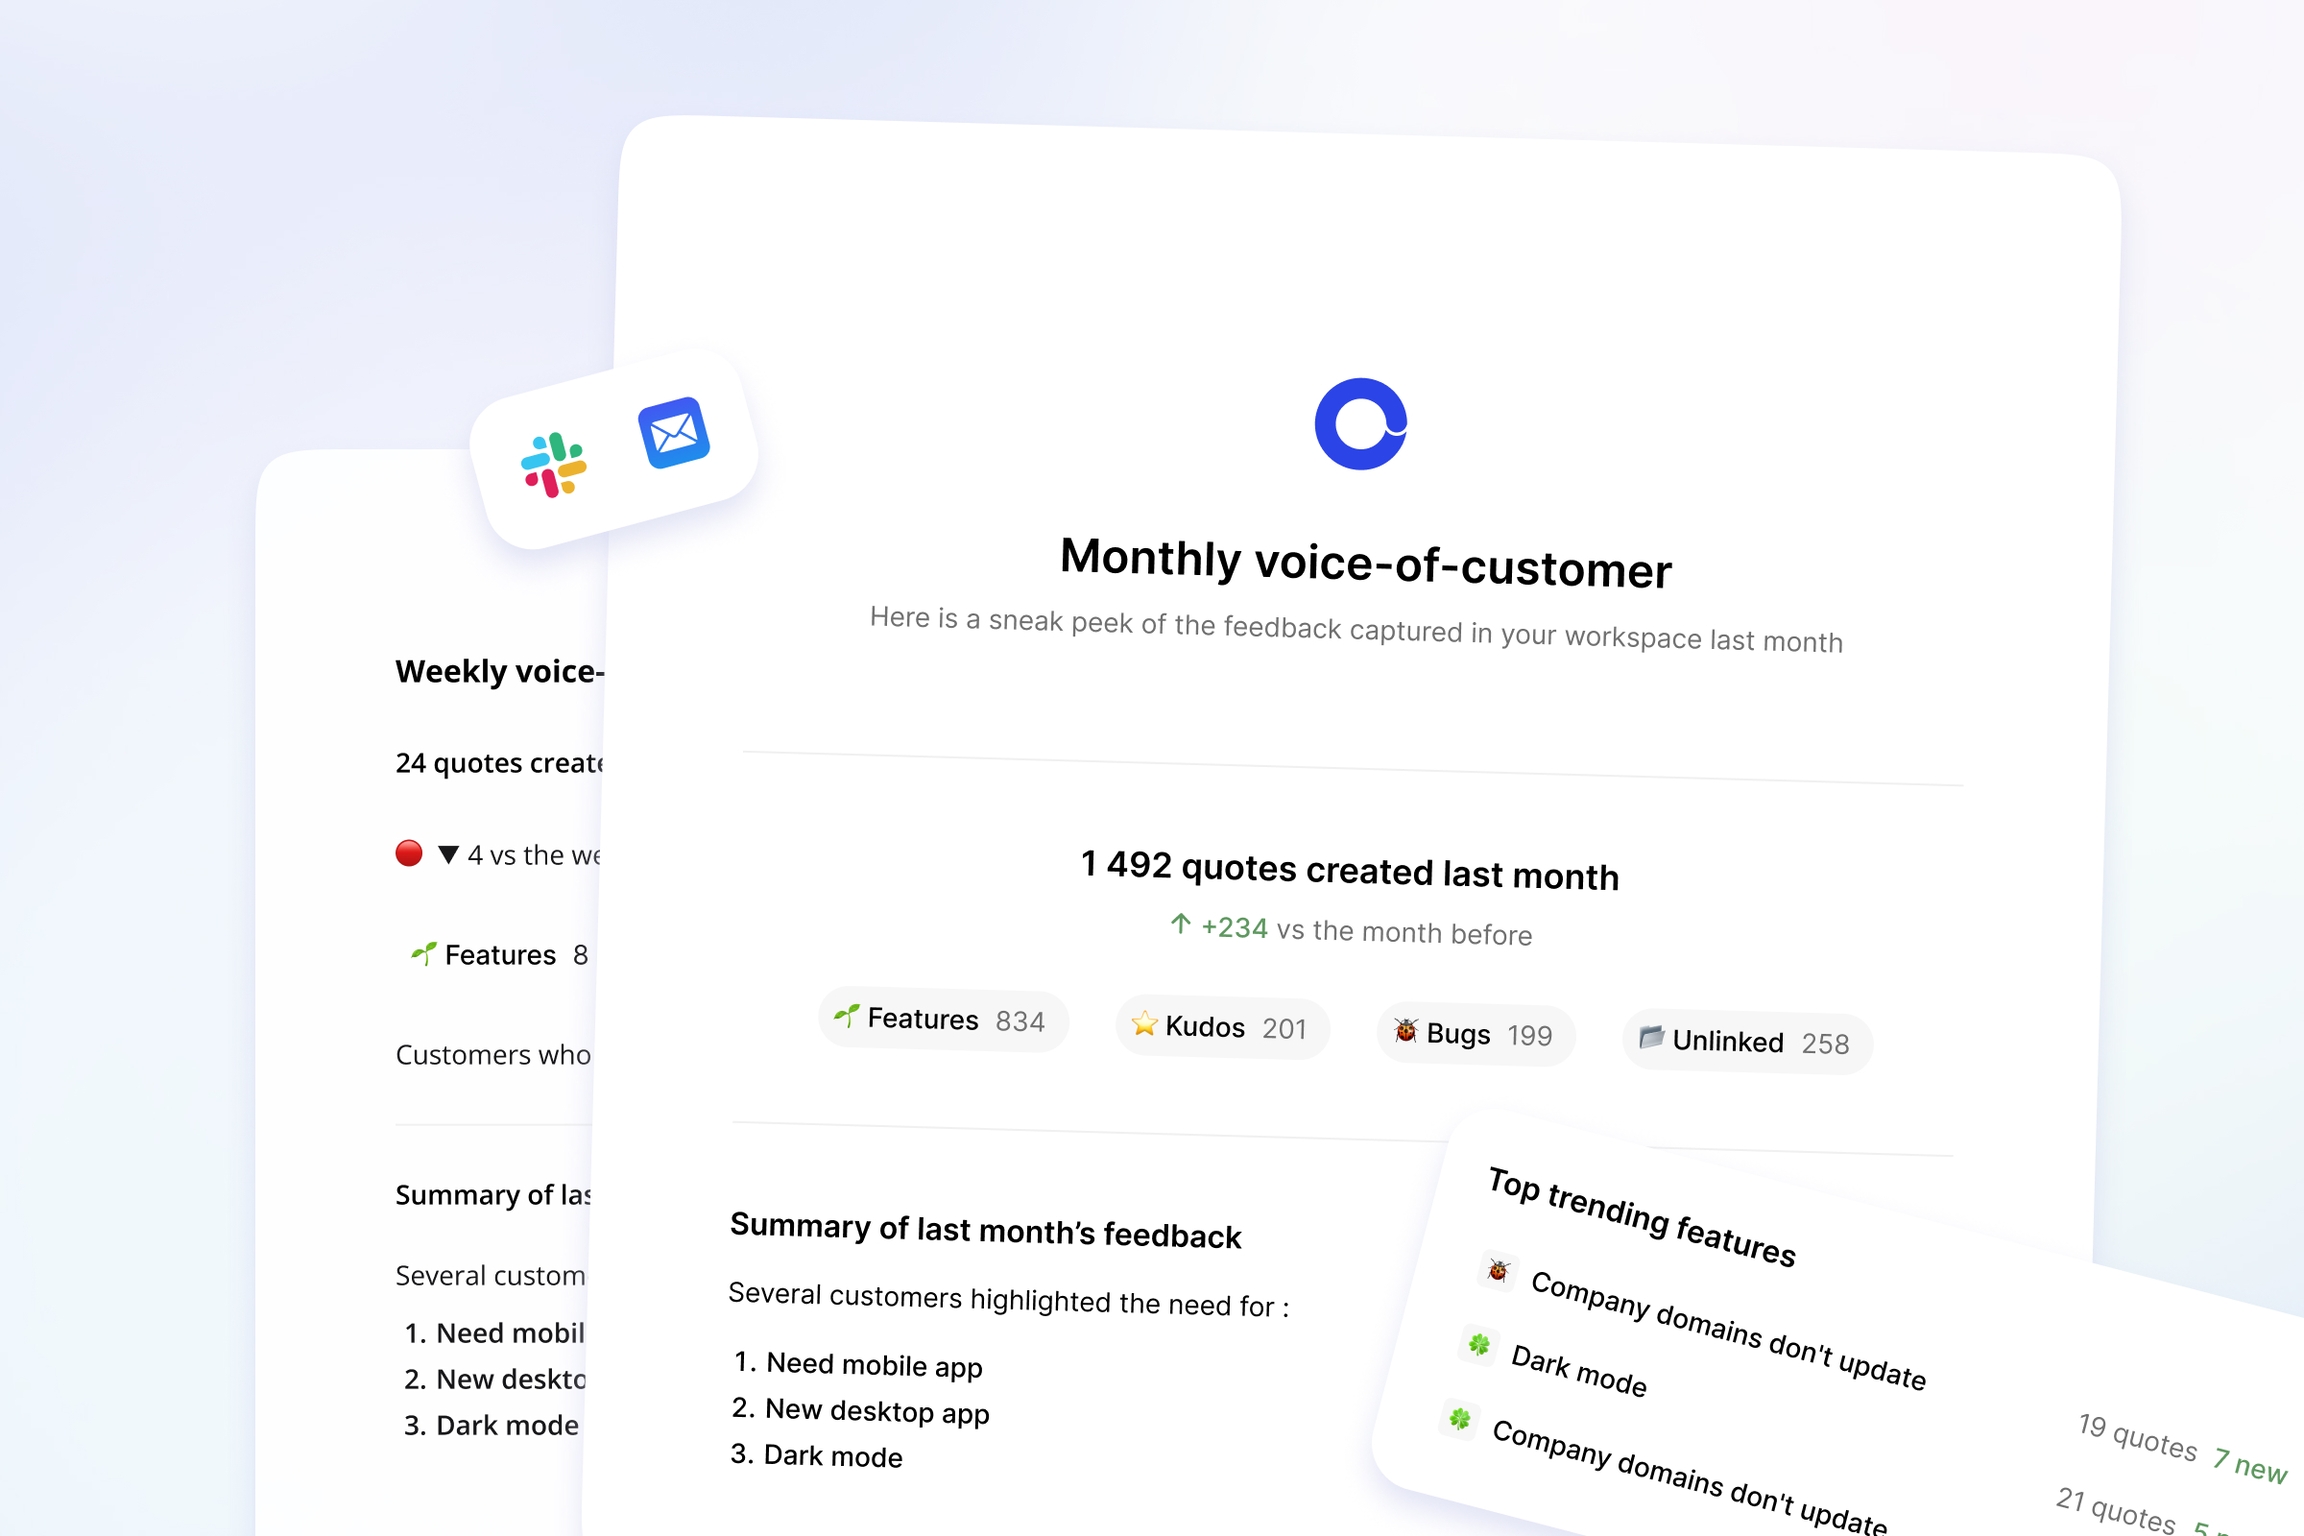
Monthly voice-of-customer reports
Your workspace members will receive a summary of this dashboard.
It's a super nice way to keep up with what your customers are saying about your product.
Every month, you'll now receive:
An AI-generated summary of your recent customer feedback
The number of customer quotes extracted from incoming feedback
What those quotes relate to (features, problems, bugs, kudos, etc)
Customers who gave the most feedback
Top trending features
By default, the report is sent via Slack and email but you can customize your preferences in your personal settings.
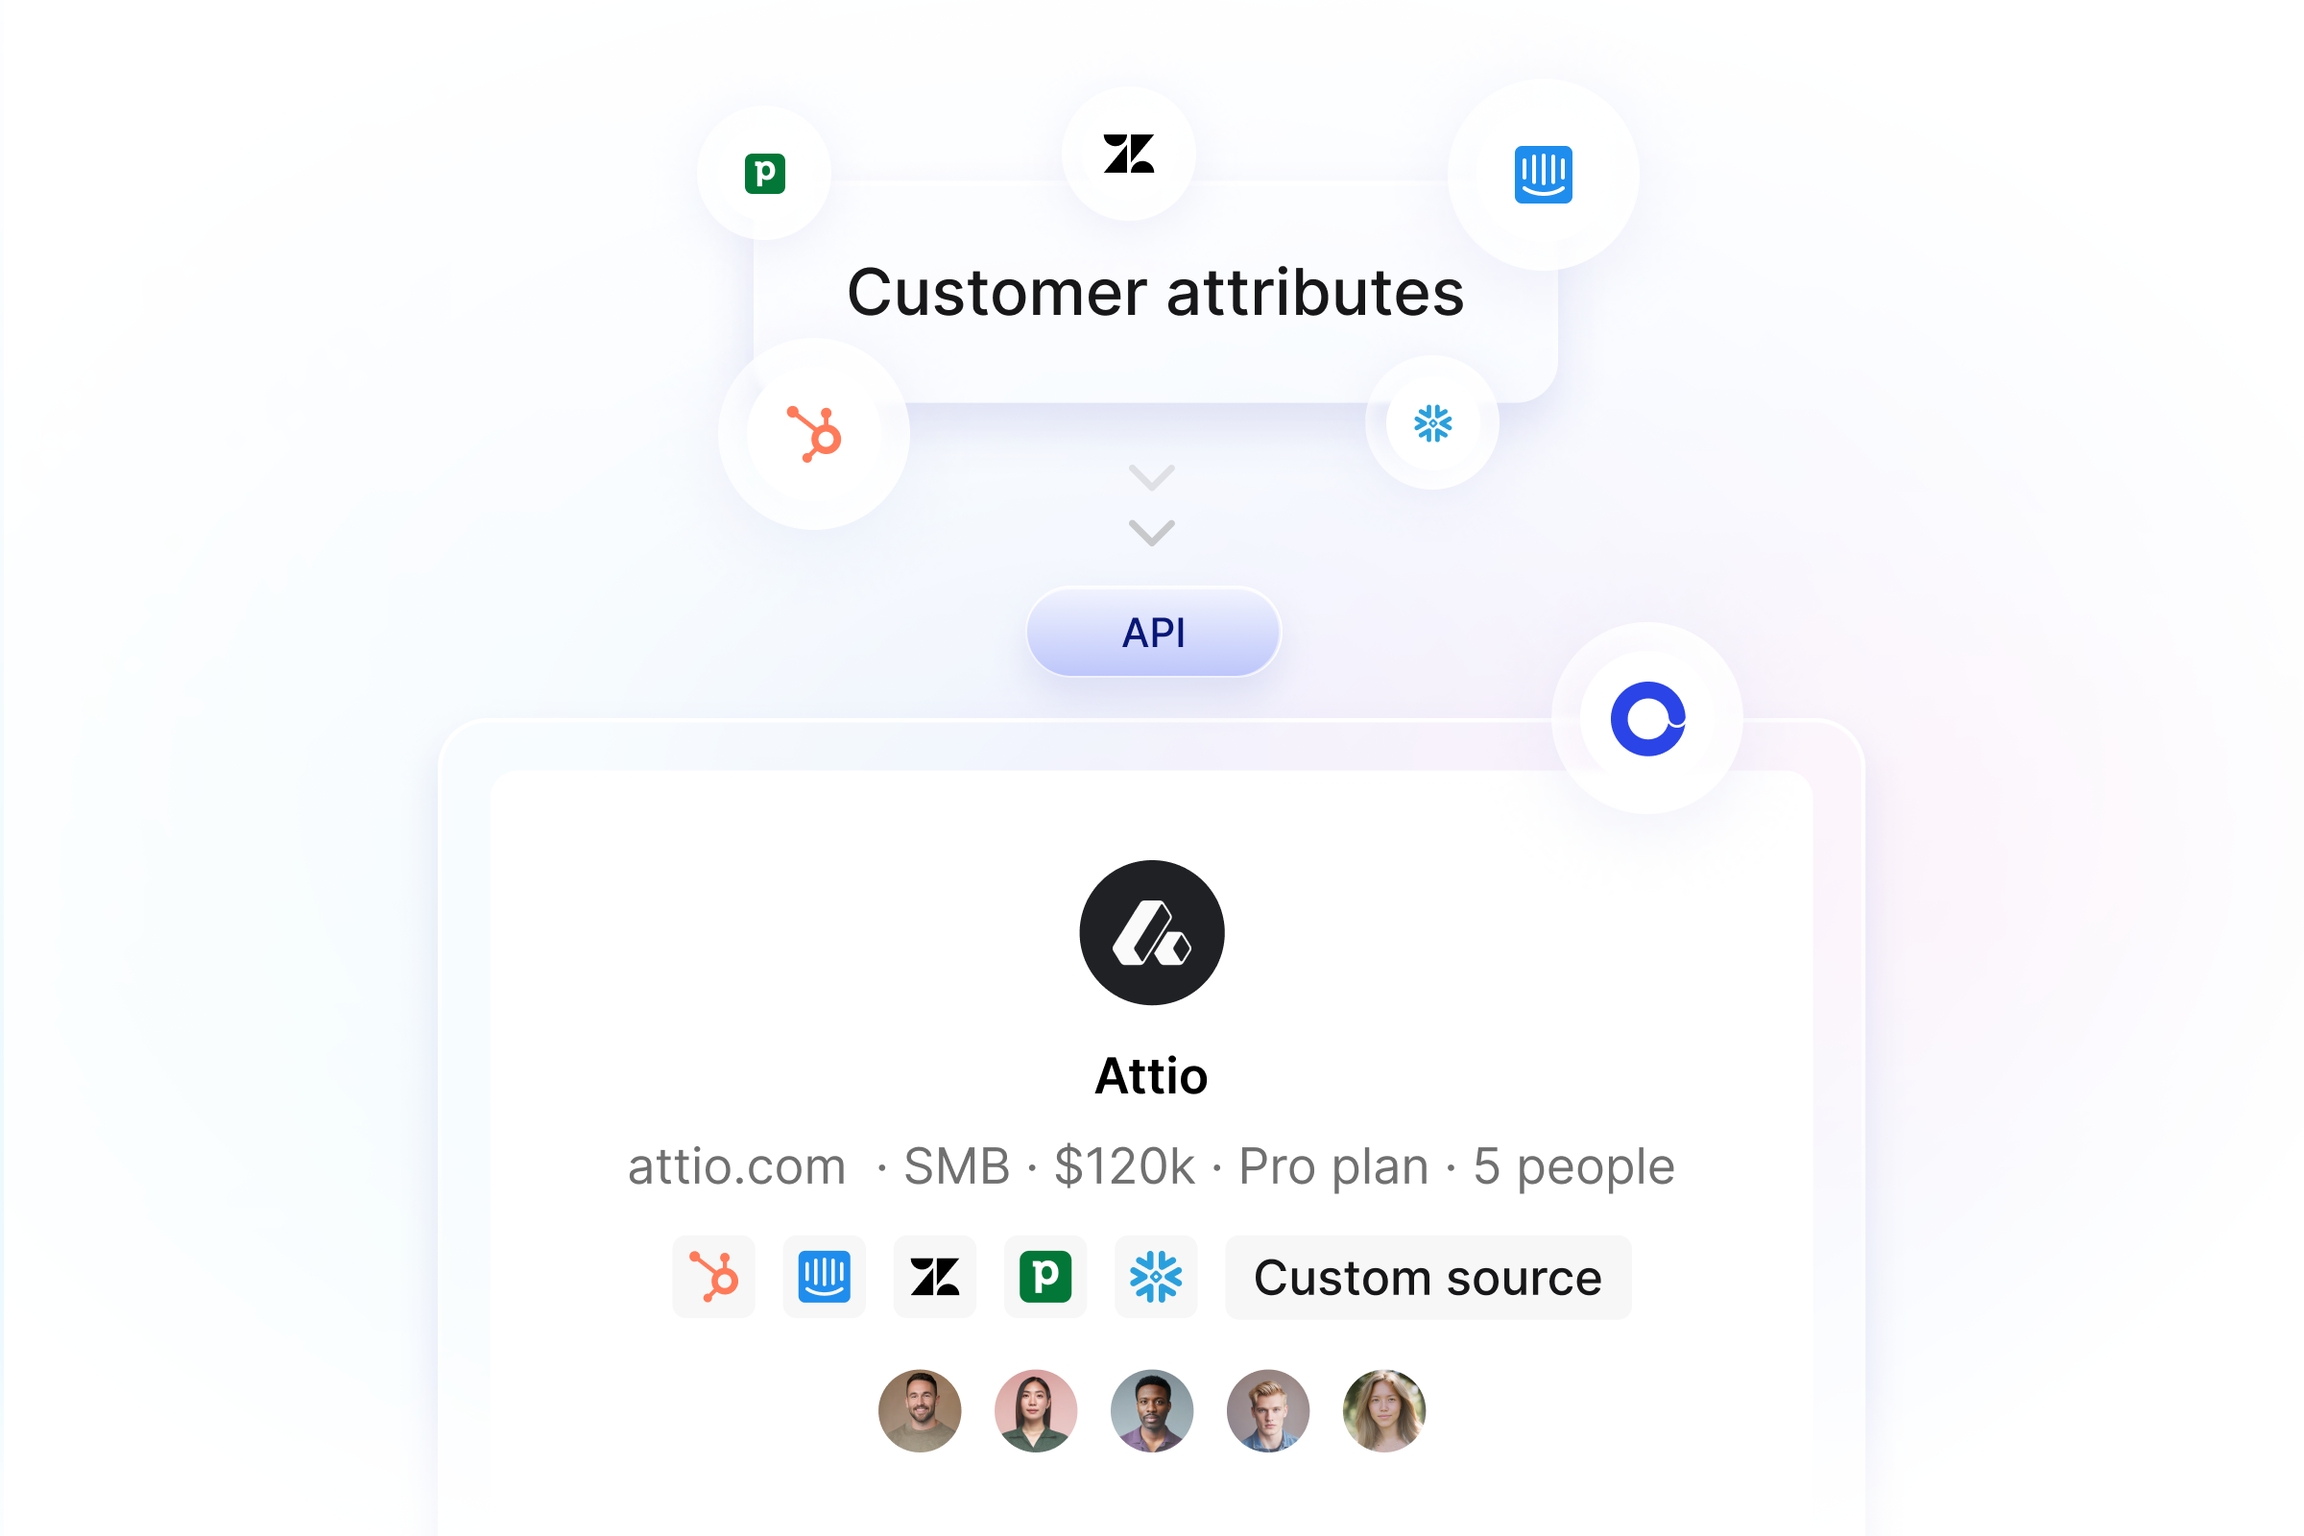
Customer attributes synced with API 🔄
Sync your customer attributes directly with Cycle's API. Bring your CRM data into Cycle in no time – think ARR, license count, customer segment, plan, etc
Your dashboard will always have the latest data, enabling advanced analysis and real-time insights.
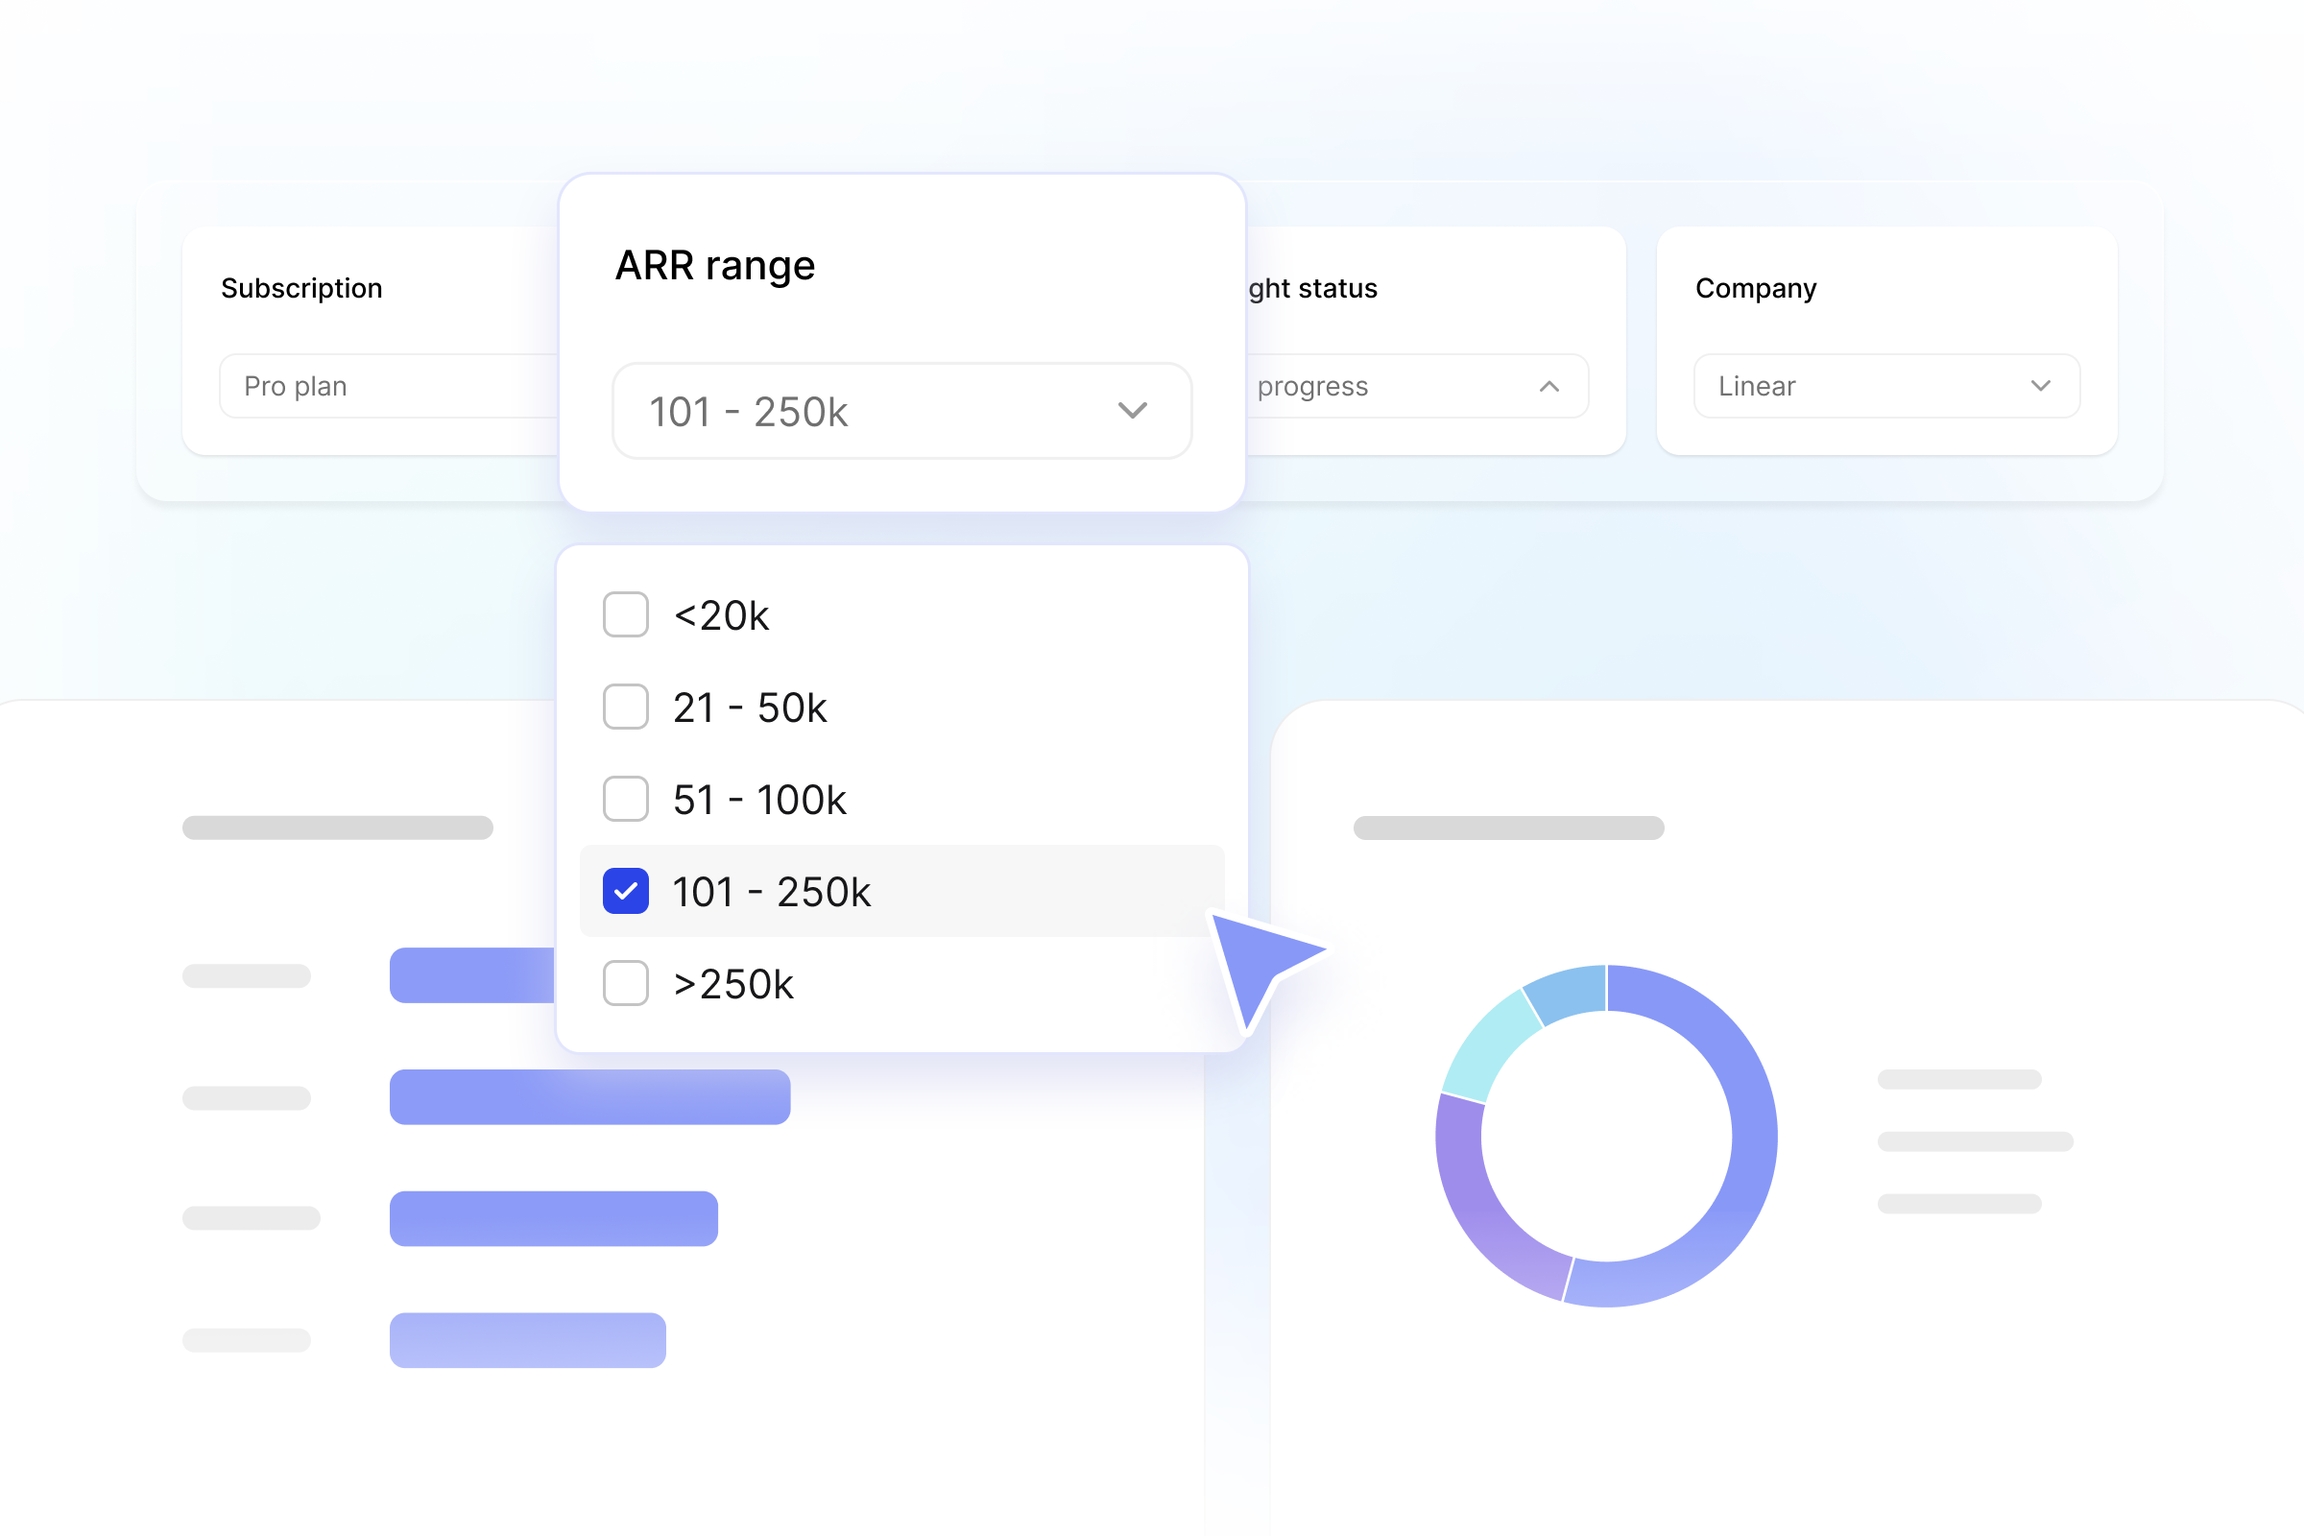
Imagine filtering your customer voice dashboards by ARR to understand how customer needs vary across segments.
Can't wait to see what customer voice insights you'll be extracting 💪
Last updated
Was this helpful?